
 No Comments
When it comes to shopping, people with more money buy more products for higher prices. No surprises there.
But when it comes to shopping on Amazon, prices and brands may vary but access and customer experience are equalizers for consumers of different income levels.
So how does that affect consumer spending behavior, and has that changed in the COVID-19 pandemic as more and more consumers are tightening their spending?
Jungle Scout conducted research on consumer spending behaviors in 2020* to dig into these details and more…
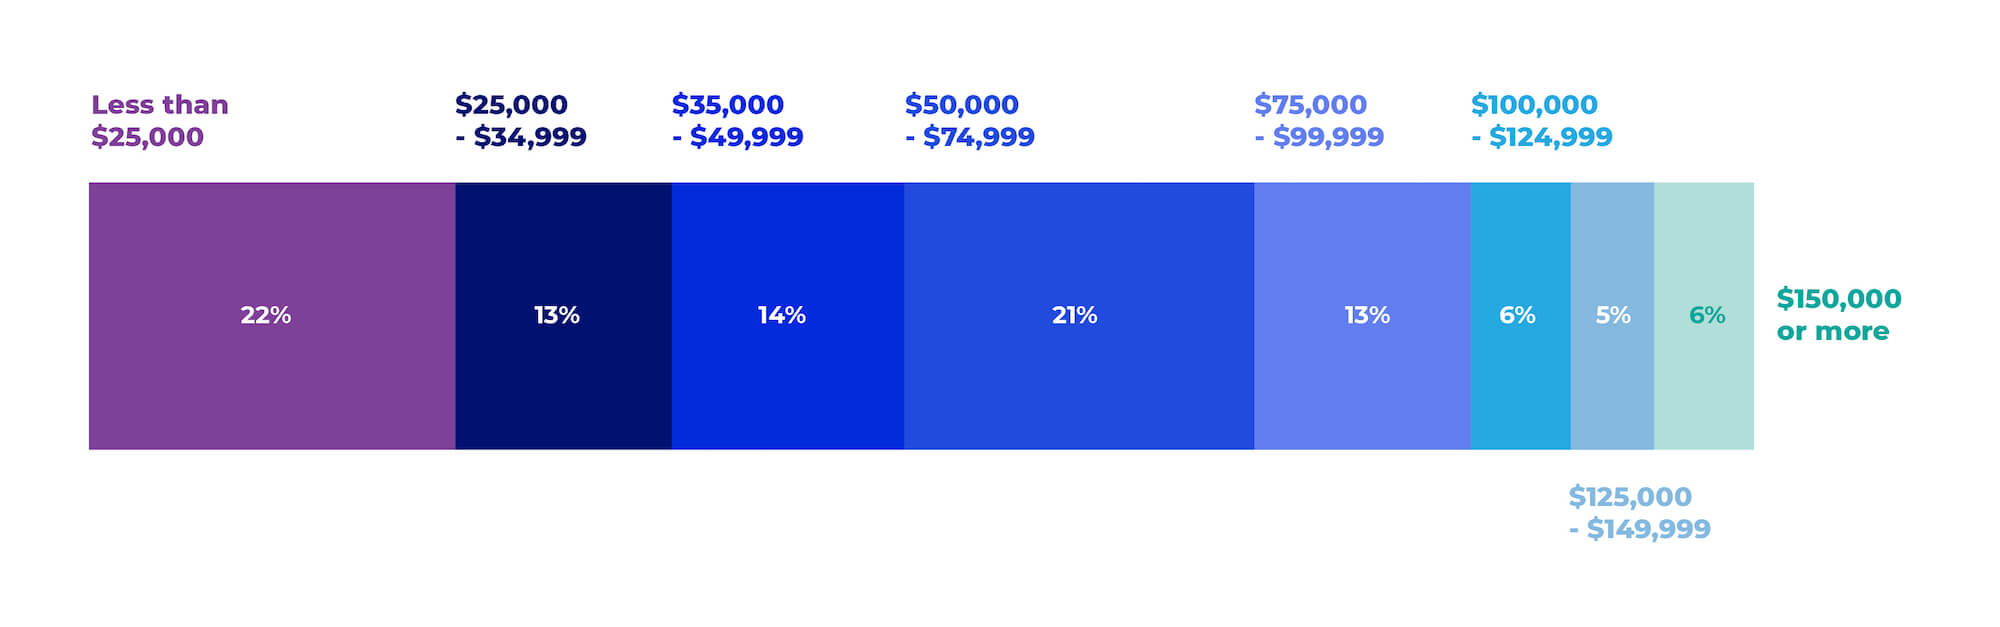
How much income do most households have?
Most consumers (83%) take home less than $100,000, while just six out of 100 people say their income is $150,000 or more.
Amazon was, and still is, consumers’ favorite online store
But, regardless of household income, consumers said Amazon is the online store they shop at most often during COVID-19. It was also the most popular marketplace across all household incomes PRE-pandemic.
The second and third most popular stores during COVID-19 varied slightly by income, with the top and bottom income-tiers choosing BestBuy and eBay for their third most-shopped online store:
- Less than $25,000: Shoppers at this income level said Walmart was their second most-frequented online store, while eBay was their third
- All income levels between $25,000 – $149,999: Walmart and Target
- $150,000 and over: Target and BestBuy
What factors influence purchasing decisions for consumers at higher income levels?
1. Best product features
- 77% of people reporting a household income of $125,000 – $149,999 said they look for products with the most impressive features
- Those with a household income of less than $25,000 are the least likely to buy an item based on its features (15% said it was not a determining factor at all)
2. Best product reviews
- And while all segments reported at least 68% of respondents saying reviews are important when making a buying decision, those who reported an income of $125,000 or greater said it was even more important (an average of 84%).
3. Lowest Price
- Price is important to most shoppers too, though.
- Two groups — with household incomes of $25,000-$34,999 and $50,000-$74,999 — are the most likely to buy something based on its price (76% and 77% respectively)
- Shoppers with a household income of $100,000 and over are least likely to purchase because of price; an average of 12% said price wasn’t a consideration when they were deciding whether or not to buy an item
4. Fast Shipping
- As for fast shipping, those with a household income of $75,000 to $99,999 are the least likely to buy based on delivery time (32%)
- Whereas, people who said their household income is $125,000 or higher want a faster shipping rate (an average of 59%)
5. Product Recommendations
- Finally, when it comes to Amazon’s product recommendations, 69% of households with an income of $125,000 – $149,999 will consider making a purchase based on Amazon’s curated suggestions.
Spending online and on Amazon hasn’t changed during COVID-19
Though lower-income consumers said that their overall spending since the start of the pandemic hasn’t really changed, those with a higher income reported spending less.
But, when it comes to spending online and on Amazon during the pandemic, everyone — regardless of income — said they’re spending about the same as they were before.
During the pandemic, all income levels focused their spending on the essentials
Before the coronavirus restricted our movements, Amazon’s ‘Clothing’ department was the most popular category among most household incomes.
- Less than $25,000: Clothing (42%)
- $25,000 – $34,999: Clothing (49%)
- $35,000 – $49,999: Clothing (42%)
- $50,000 – $74,999: Beauty & Personal Care (44%)
- $75,000 – $99,999: Clothing (45%)
- $100,000 – $124,999: Clothing (67%)
- $125,000 – $149,000: Office Supplies (55%)
- $150,000 and over: Clothing (49%)
However, during COVID-19, shoppers moved away from buying more luxurious items like clothes to buying the basics. During the pandemic, ‘Grocery’ (ie. food, cleaning supplies, etc.) has been the most popular category.
- Less than $25,000: Grocery (41%)
- $25,000 – $34,999: Grocery (34%)
- $35,000 – $49,999: Beauty & Personal Care (39%)
- $50,000 – $74,999: Grocery (49%)
- $75,000 – $99,999: Grocery (46%)
- $100,000 – $124,999: Grocery (46%)
- $125,000 – $149,000: Grocery (61%)
- $150,000 and over: Grocery (51%)
But not everyone’s shopping on Amazon right now
There is a distinct difference between household incomes when it comes to the reasons why some consumers aren’t shopping on Amazon during COVID-19.
Consumers whose income is $74,999 per year or less consistently said that their preference to shop in physical retail stores was the number one reason they’re not shopping on Amazon.
For those with a household income of $75,000 or more, the reasons for not shopping on Amazon vary.
Unlike the lower income levels who all reported not having a Prime account as the second most common reason for not shopping on Amazon, slow shipping times and not finding the right brands were Amazon-deterrents for those reporting a higher household income.
Less than $25,000:
- Prefer shopping in-store (31%)
- Don’t have a Prime account (25%)
- Don’t shop on Amazon (19%)
$25,000 – $34,999:
- Prefer shopping in-store (32%)
- Don’t have a Prime account (19%)
- Prefer other online stores or Amazon doesn’t have the brands they’re looking for (tied at 14% each)
$35,000 – $49,999:
- Prefer shopping in-store (21%)
- Don’t have a Prime account or Amazon didn’t have their item in stock (tied at 18% each)
- Don’t shop on Amazon or they didn’t like the long shipping times (tied at 13% each)
$50,000 – $74,999:
- Prefer shopping in-store (25%)
- Don’t have a Prime account (19%)
- Amazon didn’t have their item in stock (15%)
$75,000 – $99,999:
- Prefer shopping in-store and/or they don’t have a Prime account (tied at 23% each)
- Didn’t like the long shipping times and/or Amazon didn’t have their item in stock (tied at 14% each)
- Amazon doesn’t have the brands they’re looking for and/or they don’t shop on Amazon (tied at 11% each)
$100,000 – $124,999:
- Don’t have a Prime account (40%)
- Prefer shopping in-store (30%)
- Amazon didn’t have their item in stock (20%)
$125,000 – $149,000:
- Amazon doesn’t have the brands they’re looking for (33%)
- No one said they preferred to shop elsewhere
- All other reasons (like not having a Prime account and preferring to shop in-store) tied at 17% each
$150,000 and over:
- Don’t have a Prime account and/or they didn’t like the long shipping times (tied at 22% each)
- Three reasons — not shopping on Amazon; preferring to shop elsewhere; and/or Amazon didn’t have their item in stock — tied at 11% each
- No one said they preferred to shop in-store; nor did anyone say that Amazon doesn’t have the brands they’re looking for or carry the products they’re interested in
The higher the income, the bigger the Amazon loyalist
As an individual’s household income goes up, so too does their perspective of the platform. In fact, wealthier shoppers are more positive about Amazon, saying COVID-19 has increased their admiration of the company.
- Less than $25,000: 48% have developed a greater appreciation for Amazon since the start of the pandemic
- $25,000 – $34,999: 43%
- $35,000 – $49,999: 50%
- $50,000 – $74,999: 56%
- $75,000 – $99,999: 53%
- $100,000 – $124,999: 58%
- $125,000 – $149,000: 67%
- $150,000 and over: 58%
Higher earners also value being able to shop on the site more than low-income earners, and think the store is good for consumers. Low-income shoppers, on the other hand, aren’t as enamored with Amazon.
- Less than $25,000: 59% value being able to shop on Amazon and 63% think Amazon is a good store for shoppers
- $25,000 – $34,999: 67% and 72% respectively
- $35,000 – $49,999: 66% and 63% respectively
- $50,000 – $74,999: 75% and 83% respectively
- $75,000 – $99,999: 74% and 74% respectively
- $100,000 – $124,999: 77% and 80% respectively
- $125,000 – $149,000: 88% and 81% respectively
- $150,000 and over: 73% and 79% respectively
In fact, if shoppers with a higher household income could only pick one marketplace to buy from, they’re more likely to choose Amazon as their go-to store than those with a smaller income:
- Less than $25,000: 47% said they would choose Amazon if they could only shop at one store
- $25,000 – $34,999: 49%
- $35,000 – $49,999: 48%
- $50,000 – $74,999: 54%
- $75,000 – $99,999: 55%
- $100,000 – $124,999: 61%
- $125,000 – $149,000: 65%
- $150,000 and over: 60%
The more money a consumer earns, the more they shop on Amazon
For the most part, as household income increases so does the frequency with which consumers shop on Amazon.
Two out of three consumers who reported an income between $125,000 and $149,999 shopped on the platform most often — 66% said they bought from the store at least once a week.
- Less than $25,000: 25% of shoppers with an income of less than $25,000 shop on Amazon weekly
- $25,000 – $34,999: 31%
- $35,000 – $49,999: 26%
- $50,000 – $74,999: 31%
- $75,000 – $99,999: 35%
- $100,000 – $124,999: 44%
- $125,000 – $149,000: 66%
- $150,000 and over: 53%
And the big spenders on Amazon?
It’s little wonder that (in general) the larger the income, the more a consumer is willing to spend on a product. As we move up the household income scale, we go from spending a maximum of less than $50 on a product to spending as much as $500.
- Less than $25,000: 32% of people earning less than $25,000 said the maximum amount they would spend on a product is under $50
- $25,000 – $34,999: 29% — $101 – $250 for a product
- $35,000 – $49,999: 27% — $51 – $100 for a product
- $50,000 – $74,999: 25% — $51 – $100 for a product
- $75,000 – $99,999: 25% — $101 – $500 for a product
- $100,000 – $124,999: 25% — $251 – $500 for a product
- $125,000 – $149,000: 29% — $251 – $500 for a product
- $150,000 and over: 32% — $251 – $500 for a product
And for those earning over $150,000 each year, 16% said they’d be okay with spending more than $1,000.
Not to mention, Prime Day is twice as popular with the biggest earners than it is with those in the lowest income bracket.
Nearly twice as many people who reported a household income of more than $150,000 say they are going to shop during Prime Day 2020 in comparison to those whose income is less than $25,000 — 50% vs 27% respectively.
Household-income demographics
Men have more money than women
When it comes to the lower-level income brackets, more women than men reported a household income of less than $100,000.
At the $125,000 level, however, the majority changes. Significantly more men than women said their household income meets or exceeds $125,000.
- Less than $25,000: 54% of women’s household income is less than $25,000 vs 43% of men
- $25,000 – $34,999: 52% women vs 45% of men
- $35,000 – $49,999: 52% of women vs 46% of men
- $50,000 – $74,999: 54% of women vs 46% of men
- $75,000 – $99,999: 52% of women vs 47% of men
- $100,000 – $124,999: 50% of women vs 50% of men
- $125,000 – $149,000: 60% of men vs 40% of women
- $150,000 and over: 58% of men vs 42% of women
The lower the household income, the higher the unemployment rate
Not surprisingly, the smallest household income has the largest group of unemployed shoppers (47%). It also has the largest group of students (10%).
The largest group of employed individuals (69%) report having a household income $125,000 or greater — also not surprising.
- Less than $25,000: 22% of respondents earning less than $25,000 per year are employed, while 47% unemployed or furloughed
- $25,000 – $34,999: 43% and 28% respectively
- $35,000 – $49,999: 49% and 35% respectively
- $50,000 – $74,999: 49% and 27% respectively
- $75,000 – $99,999: 65% and 21% respectively
- $100,000 – $124,999: 61% and 25% respectively
- $125,000 – $149,000: 69% and 13% respectively
- $150,000 and over: 69% and 18% respectively
*Methodology
In May 2020, Jungle Scout conducted an anonymous survey of 1,006 U.S. consumers. We asked them about their buying preferences and behaviors.
Respondents ranged in age from 18 to 75+, and represent every U.S. state, all genders and employment types, and various levels of income.
For more information about this article and Jungle Scout’s data, please contact [email protected].